The Hidden Risk in Oncology Expansion: Entering the Right Market at the Wrong Time


The oncology sector continues to draw unprecedented investment from pharmaceutical and biotech companies worldwide. With the U.S. National Cancer Institute (NCI) estimating 2,041,910 new cancer diagnoses in the United States alone in 2025, the patient need is undeniable. Yet the very magnetism of this market conceals a strategic trap that has ensnared countless entrants: entering the right therapeutic space at precisely the wrong moment in its lifecycle.
This is not a failure of science. It is a failure of timing intelligence and it is far more common, and far more consequential, than the industry acknowledges publicly.
The Illusion of the Expanding Market
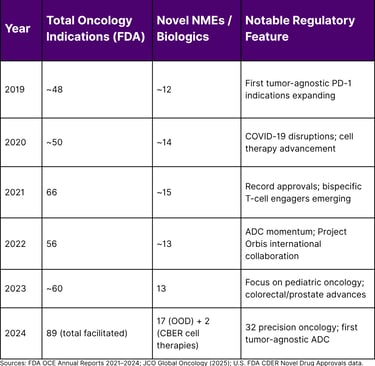
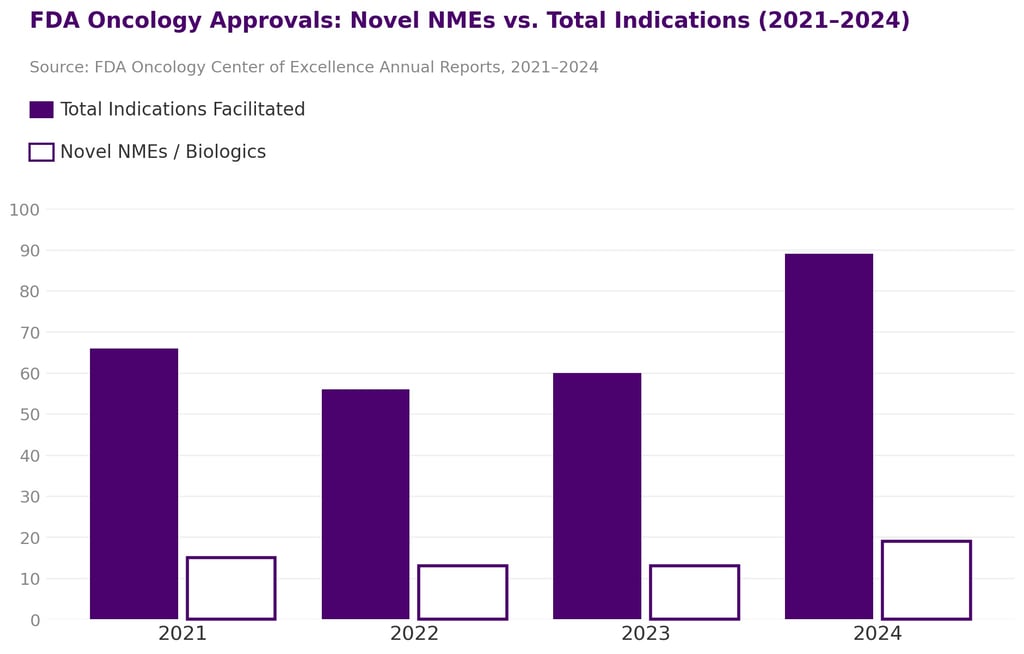
At first glance, the oncology pipeline has never looked more robust. The U.S. Food and Drug Administration's Oncology Center of Excellence (OCE) facilitated 89 oncology drug and biologic product approvals in 2024 alone including 19 new molecular entities or biologics and 34 new indication expansions for previously approved drugs. Additionally, 76 oncology devices were authorized in the same year.
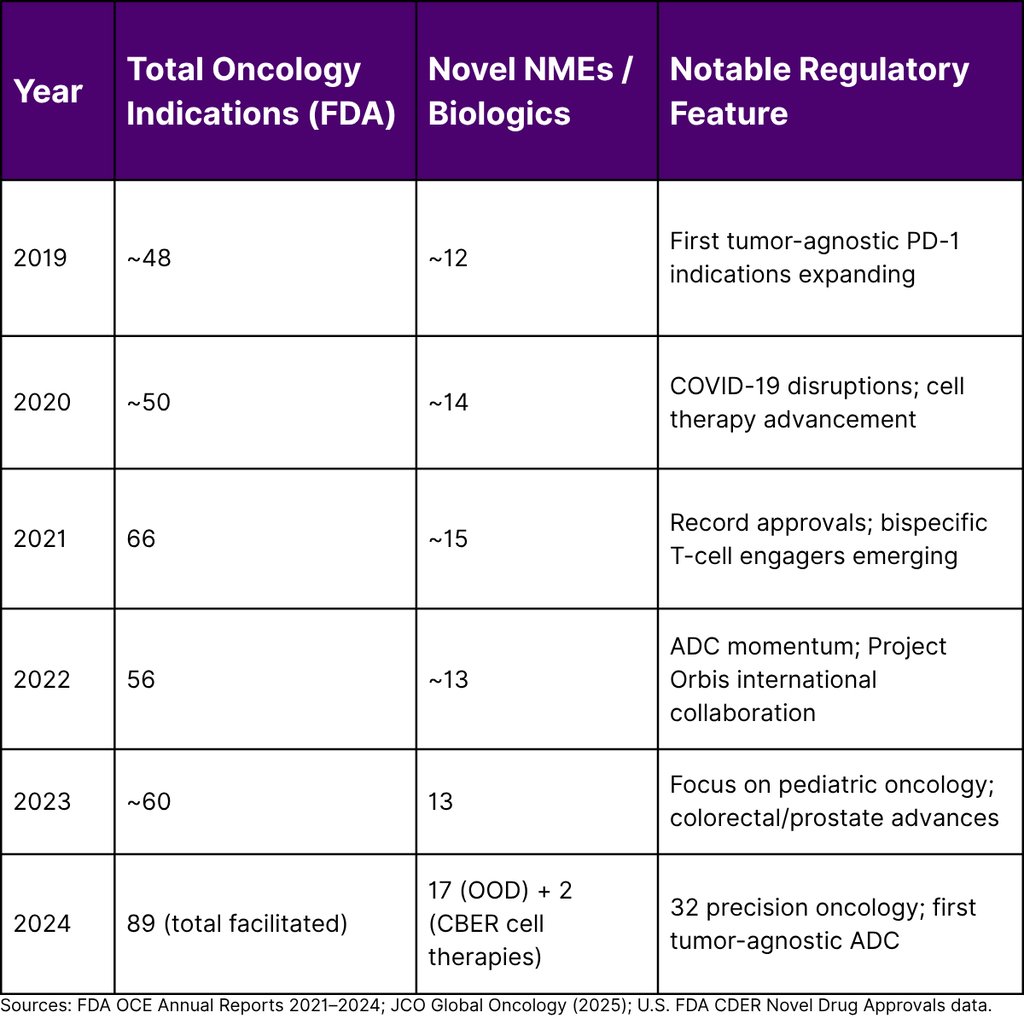
This volume is not an anomaly. Between 2019 and 2024, the FDA granted 207 oncology indications. The pipeline is accelerating. But acceleration in approvals does not translate uniformly into commercial opportunity particularly for late entrants.
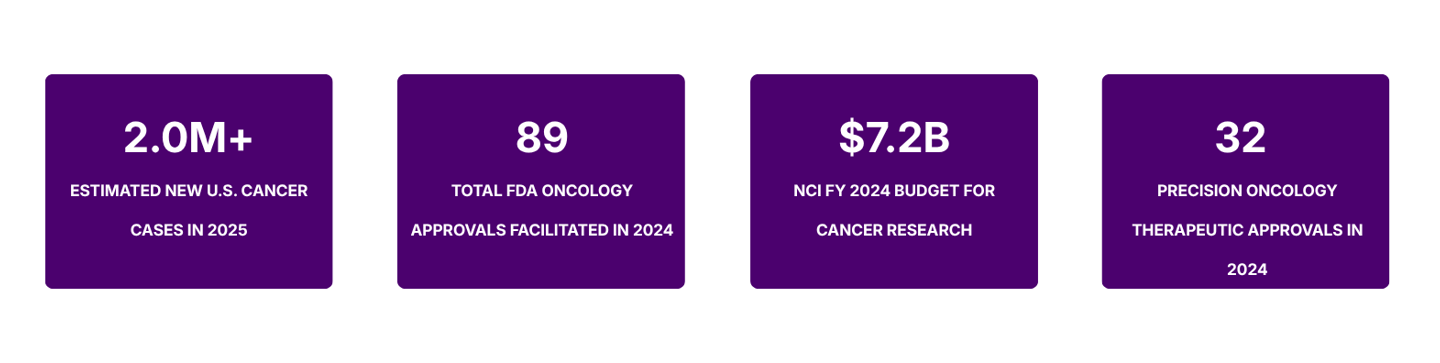
These numbers paint a picture of extraordinary scientific momentum. They do not paint a picture of uniform commercial viability especially for companies making entry decisions today without rigorous market timing analysis.
What "Right Market, Wrong Time" Actually Looks Like
The oncology market is not monolithic. It is a mosaic of disease-specific ecosystems, each with its own lifecycle stage. A therapeutic space that was underserved three years ago may today be crowded with approved agents, converging clinical trial designs, and payer fatigue. Conversely, spaces that appear nascent may be months away from a transformative approval that resets the entire competitive landscape.
"In oncology, knowing where to play is table stakes. Knowing when to play and when not to is the actual competitive advantage."
The Approval Velocity Problem
The FDA OCE approved 17 novel drugs in 2024 through the Office of Oncologic Diseases, spanning gynecologic, genitourinary, lung, gastrointestinal, breast, thyroid, leukemia, lymphoma, and myelodysplastic syndromes. The 2024 OCE Annual Report also highlighted that 32 precision oncology therapeutic approvals were completed including the first tumor-agnostic approval of an antibody-drug conjugate for HER2-overexpressing tumors.
For a company that began its non-small cell lung cancer (NSCLC) program in 2021, the approval of multiple novel agents since then in overlapping molecular subgroups may have fundamentally shifted the commercial addressable market they originally modeled. This is the approval velocity problem: pipelines are designed against static snapshots of landscapes that move continuously.
The Subtype Fragmentation Paradox
FDA data reveals a clear trend: oncology approvals are increasingly targeting narrower molecular subtypes. The 2024 approval environment saw several therapies approved for rare or ultra-rare cancer presentations, while the 2025 novel drug cohort 16 novel oncology drug approvals showed that 69% of novel small molecule approvals in 2025 were small molecules, nearly twice the 38% average of the prior three years. This reflects increasing specificity: therapies targeting mutation-specific pathways in smaller and smaller patient populations.
This fragmentation has a dual effect. It creates new opportunity windows in underserved subtypes. But it also compresses commercial timelines, as payers apply value-based scrutiny to therapies serving patient populations in the hundreds or low thousands rather than hundreds of thousands.
Annual FDA Oncology Approval Trends (2019–2024)
The Four Dimensions of Timing Risk in Oncology
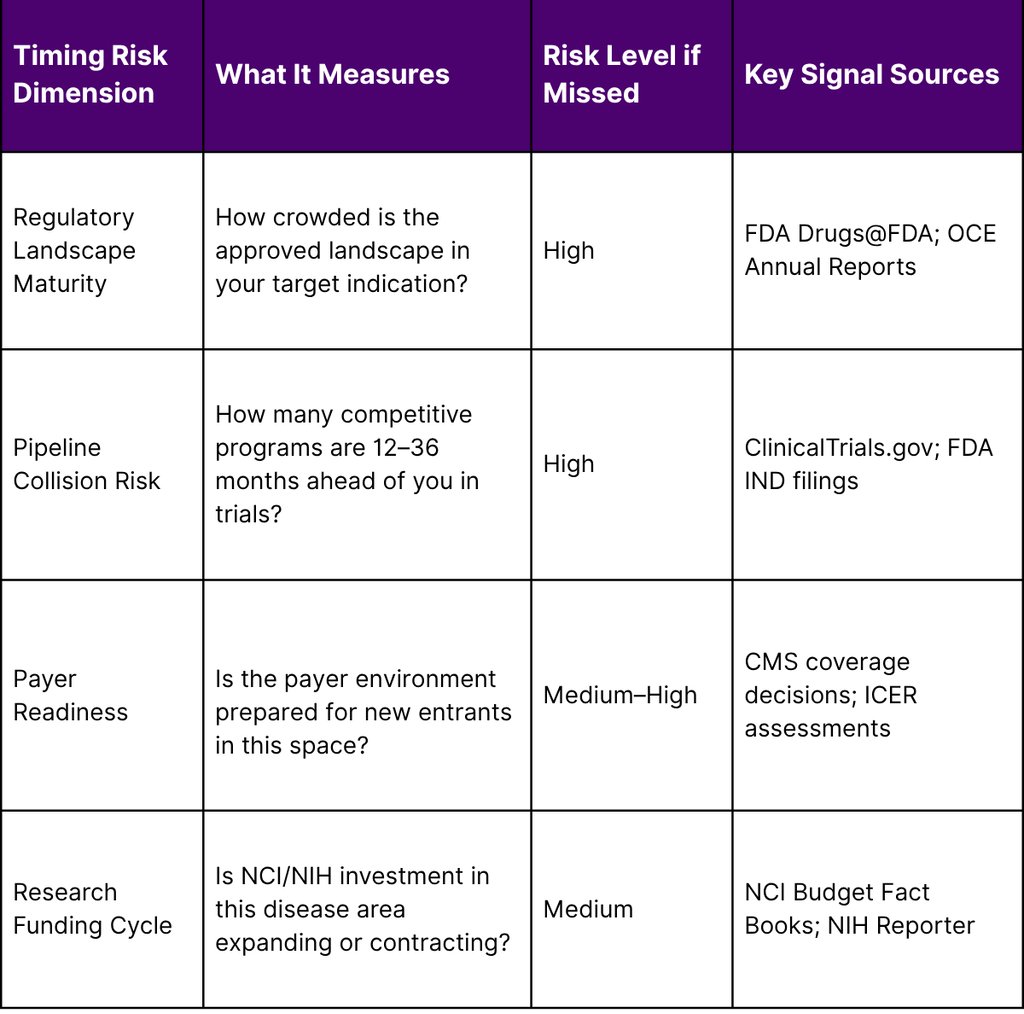
Timing risk in oncology is multidimensional. Companies that focus exclusively on competitive analysis or regulatory pathway clarity often miss the intersection where these dimensions converge to either accelerate or destroy their commercial position.
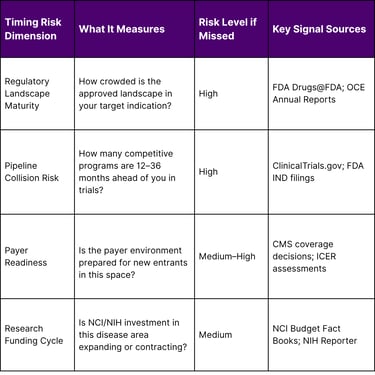
Dimension 1: Regulatory Landscape Maturity
The FDA's accelerated approval pathway designed to speed access for serious conditions has created a paradox. Many oncology indications now have multiple agents approved on surrogate endpoints, with confirmatory trial requirements pending. When new entrants design their clinical programs, they face not just approved therapies but also the anticipated conversion of accelerated approvals to full approval agents that will entrench themselves in treatment algorithms before a new entrant completes Phase III.
⚠ Regulatory Timing Note
Early in 2025, federal workforce reductions affected approximately 3,500 FDA positions including scientists, policy staff, and drug review personnel. Independent analysis suggests application volumes have risen while throughput slowed with De Novo classification decisions dropping approximately 50% from January–July 2025 compared to the same period in 2024. For oncology entrants, this introduces additional regulatory timeline uncertainty beyond the usual scientific complexity.
Dimension 2: Pipeline Collision Risk
More than 2,000 new oncology clinical trials initiated in 2023 alone, featuring novel modalities including cell and gene therapies, antibody-drug conjugates, multi-specific antibodies, and radioligand therapies. A company entering an indication today competes not just with approved agents but with a dense cohort of programs that will reach read-out and potentially approval during the company's own development timeline. Without a living map of the competitive pipeline, strategy decisions are made on outdated intelligence.
Dimension 3: Payer Readiness
The NCI estimated national expenditures for cancer care in the United States at $208.9 billion in 2020. With costs continuing to rise, payers are applying increasing scrutiny to oncology reimbursement decisions. An indication space that reached FDA approval may face restrictive coverage policies, step-therapy requirements, or evidence-generation mandates that extend time-to-revenue significantly beyond approval timelines. Entering a space where payer alignment has not been assessed is a compounding risk that extends well beyond regulatory approval.
Dimension 4: NCI Research Funding Trajectory
The NCI's FY 2024 budget totaled $7.2 billion a 1.7% increase from the prior year, including $50 million for the Childhood Cancer Data Initiative. However, the NCI's own FY 2025 funding strategy shifted significantly. With substantial reductions proposed in the President's FY 2026 budget submission, NCI adopted a more conservative funding stance focused on supporting existing research activities while reducing future-year commitments. For companies whose commercial strategies depend on NCI-funded investigator-initiated trials or academic collaborations to generate supporting real-world evidence, this funding contraction represents an indirect but material timing risk.
Cancer Burden Data as a Market Sizing Foundation
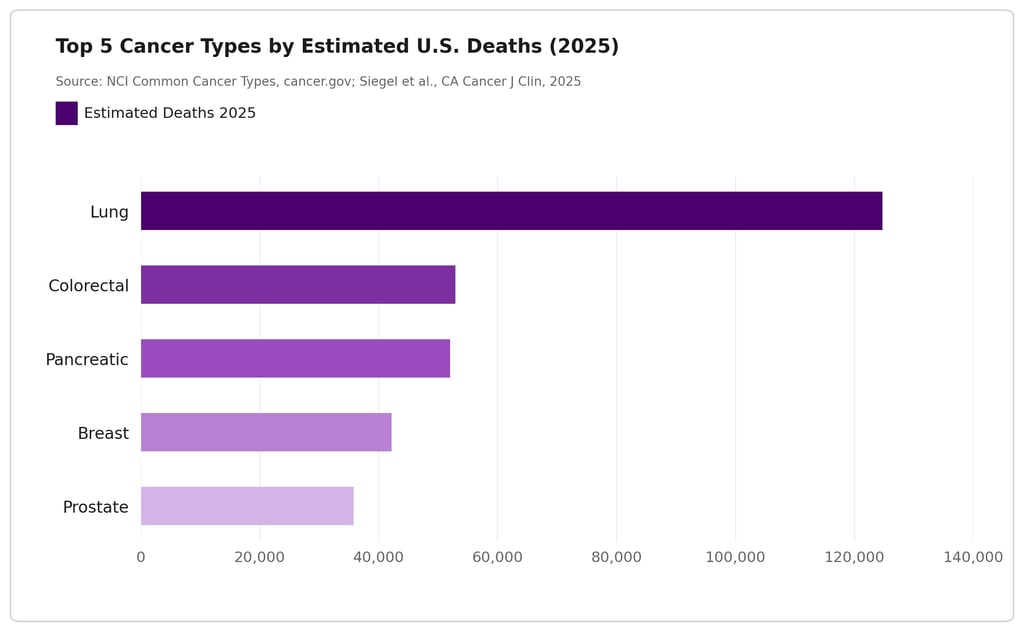
Robust timing analysis must begin with validated epidemiology. The NCI's Annual Report to the Nation, released in April 2025 and based on data from population-based cancer registries funded by CDC and NCI, provides the most authoritative U.S. incidence and mortality data available. Key findings with direct relevance to oncology market strategy include:
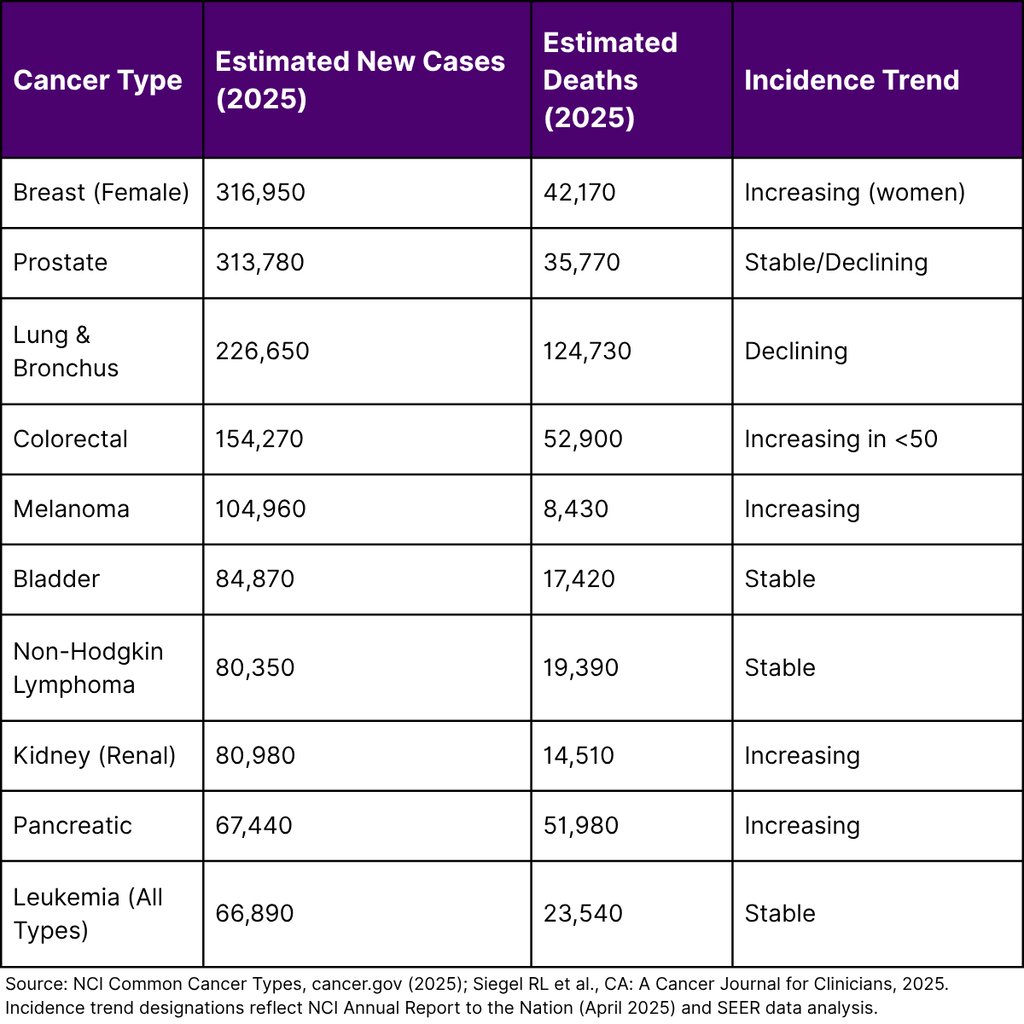
Critically, a NIH study published May 2025 in Cancer Discovery found that of 33 cancer types analyzed, 14 showed increasing incidence in at least one age group under 50 including breast, colorectal, kidney, testicular, and uterine cancers. This early-onset shift reshapes patient population profiles and creates both scientific and commercial opportunity in disease areas previously modeled against older patient demographics.
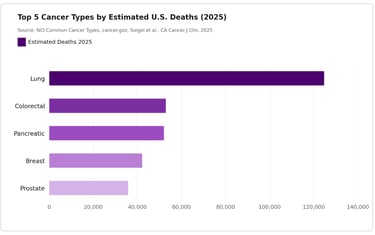
The NCI Funding Shift and Its Downstream Strategic Impact
Historically, NCI funding has been a reliable leading indicator of which disease areas will see the most investigator-initiated research, academic-industry partnerships, and real-world evidence generation. The NCI's FY 2024 budget of $7.2 billion supported comprehensive programs in cancer biology, prevention, detection, treatment, and public health. The proposed FY 2025 Professional Judgment Budget projected total funding of $11.466 billion a significant aspirational increase driven by Cancer Moonshot commitments of $1.581 billion.
However, NCI's actual FY 2025 funding policy shifted toward protecting current activities and reducing future commitments, with significant budget reductions proposed for FY 2026. This has concrete implications for companies evaluating when to initiate or accelerate oncology programs that rely on the broader academic research ecosystem:
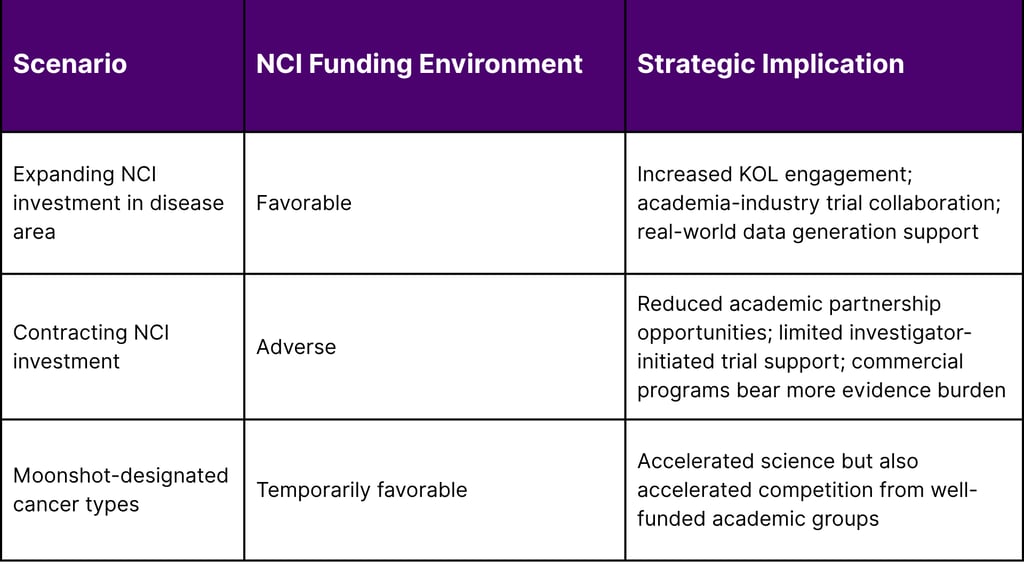
A Framework for Oncology Market Timing Assessment
Based on publicly available regulatory, epidemiological, and funding data, Fyreignis Market Research has developed a practical framework for evaluating entry timing in any oncology indication. This approach integrates four evidence streams into a composite timing score:
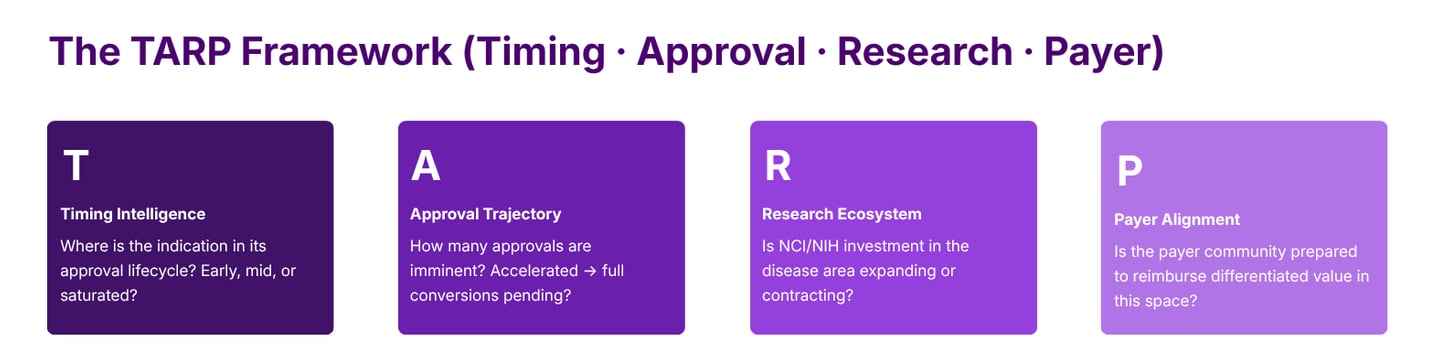
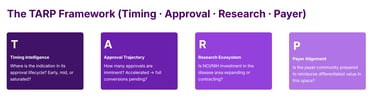
Each dimension requires validated data inputs not estimates or proxy indicators. The most defensible timing assessments draw from FDA OCE Annual Reports, NCI SEER epidemiology, NIH Reporter funding databases, and ClinicalTrials.gov pipeline mapping. The intersection of all four factors determines not whether a market is attractive, but whether it is attractive right now for a specific company's development timeline and competitive position.
The Cost of Getting Timing Wrong
Mistimed oncology entries manifest in several observable patterns. A company that enters a space twelve to eighteen months behind the leading innovator faces a fundamentally different commercial environment than one that entered at the same moment. Prescribers have established treatment habits. Payers have constructed formulary architecture. Key opinion leaders have published treatment guidelines that anchor the approved agent. The science may be equivalent; the commercial outcome rarely is.
Equally, premature entry entering before regulatory clarity has been established for a biomarker, before a companion diagnostic has been validated, or before a standard-of-care baseline has been defined in trial design can result in trial failures that have nothing to do with the molecule's efficacy. Cancer death rates declined by an average of 1.7% per year for men and 1.3% per year for women from 2018 to 2022 according to NCI data. This decline reflects accumulated correct decisions across the pipeline scientific, regulatory, and commercial. The companies that contributed most to this progress shared one trait: they understood not just what to develop, but when.
Frequently Asked Questions
Q1. How many oncology drugs did the FDA approve in 2024?
The FDA's Oncology Center of Excellence facilitated 89 oncology drug and biologic product approvals in 2024. This included 17 novel drugs approved by the Office of Oncologic Diseases, 2 new cellular therapy products approved by CBER, 34 indication expansions for previously approved products, and 76 oncology devices.
Q2. What are the most common cancers in the United States in 2025?
According to the NCI, the most common cancers in 2025 by estimated new cases are breast cancer (316,950 female), prostate cancer (313,780), and lung and bronchus cancer (226,650). In total, approximately 2,041,910 new cancer cases are estimated for 2025.
Q3. Is cancer incidence increasing among younger adults in the U.S.?
Yes. A NIH study published in Cancer Discovery (May 2025) found that incidence of 14 of 33 cancer types analyzed increased in at least one age group under 50 including breast, colorectal, kidney, testicular, and uterine cancers.
Q4. How does NCI funding affect oncology commercial strategy?
NCI funding, which totaled $7.2 billion in FY 2024, supports not just basic science but the academic research ecosystem that generates key opinion leader engagement, investigator-initiated trials, and real-world evidence that commercial sponsors depend upon. Contracting NCI funding in specific disease areas can increase the evidence burden and cost for commercial programs. Companies should track NCI Budget Fact Books and funding policy updates as part of market timing assessment.
Q5. What regulatory pathways most affect oncology market timing?
The FDA's Accelerated Approval pathway, Breakthrough Therapy Designation, Priority Review, and Fast Track designations all affect how quickly competitors can reach market. The conversion of accelerated approvals to full approval based on confirmatory trial outcomes is a particularly important timing signal. Companies should monitor the FDA's Accelerated Approvals database to map which approved agents face upcoming confirmatory readouts in their target indication.
References
National Cancer Institute. (2025). Cancer statistics. U.S. Department of Health and Human Services, National Institutes of Health.
National Cancer Institute. (2025). Common cancer types. U.S. Department of Health and Human Services.
National Cancer Institute. (2025, April 21). Annual Report to the Nation: Cancer deaths continue to fall [Press release].
National Cancer Institute. (2025). Annual Report to the Nation on the Status of Cancer [Statistics summary]. Surveillance, Epidemiology, and End Results Program.
National Cancer Institute. (2025, May 8). NIH study investigates trends in early-onset cancers [Press release].
National Cancer Institute. (2024). NCI Budget Fact Book: Fiscal Year 2024. U.S. Department of Health and Human Services.
National Cancer Institute. (2023). NCI Fiscal Year 2025 Professional Judgment Budget Proposal. National Cancer Institute. (2025). NCI Funding Policy — Current Funding Policy.
U.S. Food and Drug Administration. (2025). 2024 OCE Annual Report. Oncology Center of Excellence.
U.S. Food and Drug Administration. (2025). Oncology regulatory review 2024. Oncology Center of Excellence 2024 Annual Report.
U.S. Food and Drug Administration. (2025). Ongoing clinical oncology projects 2024. Oncology Center of Excellence 2024 Annual Report.
U.S. Food and Drug Administration. (2024). Novel Drug Approvals for 2024. Center for Drug Evaluation and Research.
U.S. Food and Drug Administration. (2025). Accelerated Approvals.
Siegel, R. L., Kratzer, T. B., Giaquinto, A. N., Sung, H., & Jemal, A. (2025). Cancer statistics, 2025. CA: A Cancer Journal for Clinicians, 75(1), 10–45.
Shiels, M. S., et al. (2025). Trends in cancer incidence and mortality rates in early onset and older onset age groups in the United States, 2010–2019. Cancer Discovery. Published May 8, 2025.
National Institutes of Health. (2023). Testimony on the FY 2024 budget request before the House.
Navigation
© 2026 FyreIgnis Market Research. All rights reserved.
Legal
info@fyreignismarketresearch.com
India