
The Orphan Drug Paradox

The pharmaceutical industry faces a profound paradox: while the FDA has granted over 7,300 Orphan Drug Designations (ODDs) since 1983, only 5% of the estimated 7,000+ rare diseases have approved treatments. This disconnect between regulatory support and therapeutic availability reveals systemic challenges in rare disease drug development, creating both a humanitarian crisis and a massive commercial opportunity. This comprehensive analysis examines the root causes of this paradox, quantifies the market gaps, and identifies strategic solutions for bridging the treatment divide.
The Magnitude of the Problem
The Numbers Behind the Paradox
The stark reality of rare disease treatment availability:
Total Rare Diseases: 7,000+ identified conditions
FDA Orphan Drug Designations: 7,300+ granted since 1983
Diseases with Approved Treatments: ~350 (5% of total)
Patients Affected: 400+ million globally
Market Opportunity: $374+ billion by 2030
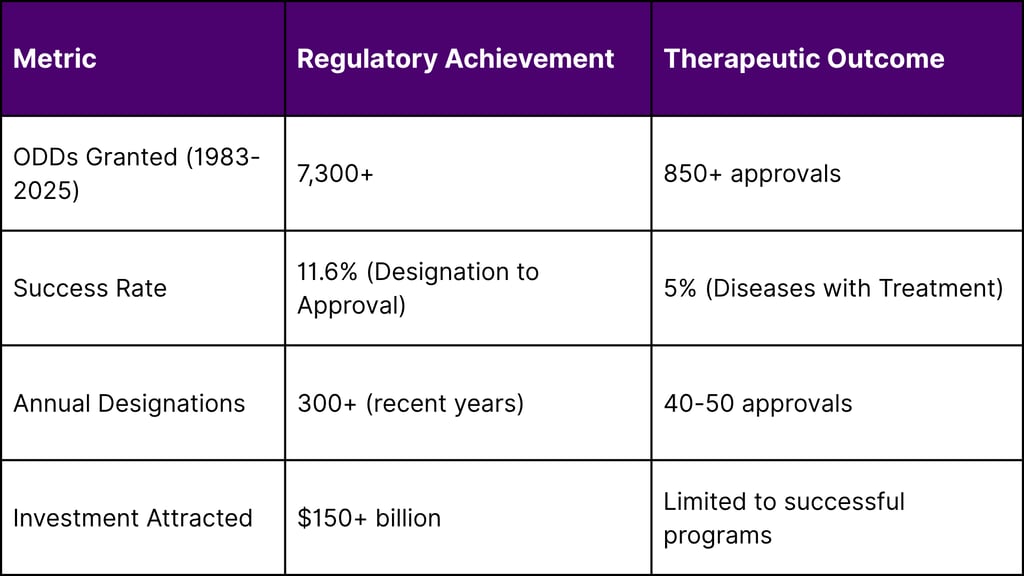
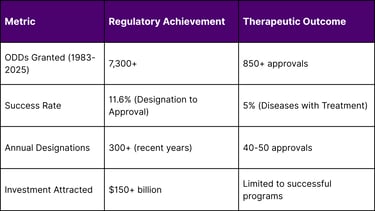
Regulatory Success vs. Therapeutic Reality
Understanding Orphan Drug Designation
The FDA Framework
The Orphan Drug Act of 1983 established criteria for ODD:
Prevalence Threshold: <200,000 patients in the U.S.
Regulatory Incentives: 7-year market exclusivity
Financial Benefits: 50% tax credit for clinical costs
Development Support: FDA guidance and fee waivers
EMA Orphan Medicine Designation
The European framework provides additional support:
Prevalence Threshold: <5 in 10,000 people
Market Exclusivity: 10 years
Protocol Assistance: Reduced-fee scientific advice
Centralized Procedure: EU-wide approval pathway
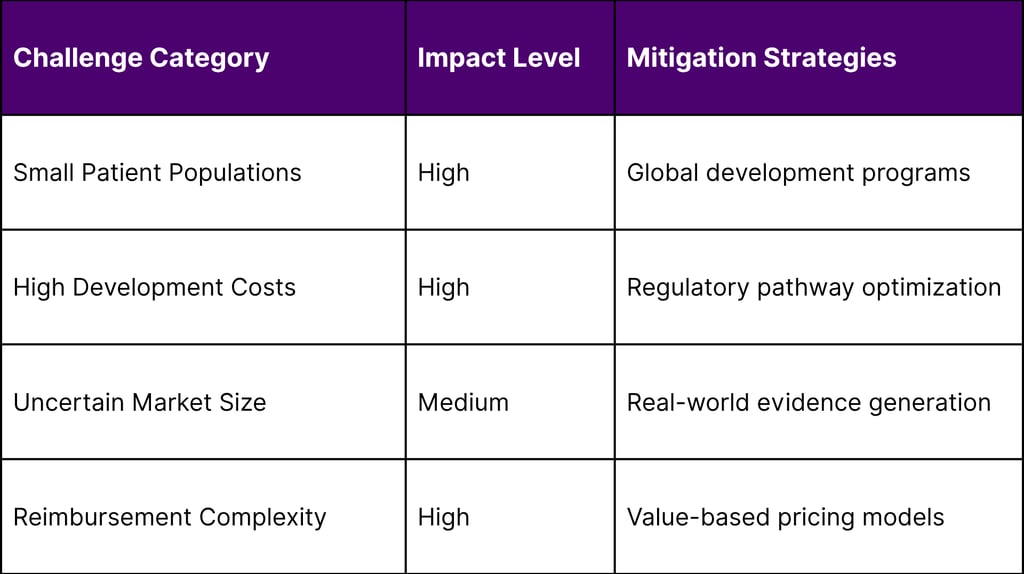
The Development Challenge Matrix
Scientific Complexity Barriers
Disease Heterogeneity:
Multiple genetic variants within single diseases
Phenotypic variability across patients
Limited understanding of disease mechanisms
Lack of validated biomarkers
Research Infrastructure Gaps:
Insufficient patient registries
Limited natural history data
Inadequate diagnostic tools
Scarce clinical trial sites
Commercial Viability Challenges
Development Timeline Analysis
Typical Rare Disease Development:
Discovery to IND: 5-7 years
Clinical Development: 8-12 years
Regulatory Review: 1-2 years
Total Timeline: 14-21 years
Total Investment: $500M-$2.5B
Disease Category Analysis
Neurological Disorders: Highest Unmet Need
Disease Burden:
Total Neurological Rare Diseases: 1,200+
Diseases with Treatments: 45 (3.8%)
Patient Population: 12+ million globally
Treatment Gap: 96.2%
Key Examples:
Huntington's Disease: ODD granted 1990, first approval 2017
ALS: Multiple ODDs, limited treatment options
Rare Epilepsies: Hundreds of conditions, <20 treatments
Neuromuscular Disorders: Significant progress but vast gaps remain
Metabolic Disorders: Moderate Success
Disease Burden:
Total Metabolic Rare Diseases: 800+
Diseases with Treatments: 85 (10.6%)
Patient Population: 8+ million globally
Treatment Gap: 89.4%
Success Factors:
Well-characterized biochemical pathways
Established diagnostic methods
Enzyme replacement therapy platforms
Academic research infrastructure
Oncological Rare Diseases: Emerging Focus
Disease Burden:
Total Rare Cancers: 200+
Diseases with Treatments: 45 (22.5%)
Patient Population: 6+ million globally
Treatment Gap: 77.5%
Development Advantages:
Established oncology infrastructure
Regulatory pathway familiarity
Biomarker development expertise
Investment community comfort
Regional Development Patterns
United States: Regulatory Leadership
Development Characteristics:
ODDs Granted: 7,300+ (global leader)
Approval Success Rate: 11.6%
Average Development Time: 12-15 years
Investment Concentration: 60% of global funding
Enabling Factors:
Robust regulatory framework
Strong intellectual property protection
Advanced clinical research infrastructure
Venture capital ecosystem
European Union: Harmonized Approach
Development Characteristics:
Orphan Designations: 2,500+ since 2000
Approval Success Rate: 14.2%
Cross-Border Collaboration: Enhanced efficiency
Academic Excellence: Strong research base
Asia-Pacific: Emerging Hub
Development Characteristics:
Regulatory Evolution: Rapid framework development
Manufacturing Advantages: Cost-effective production
Population Genetics: Unique disease patterns
Government Support: Increasing investment
The Economics of Rare Disease Development
Cost Structure Analysis
Development Cost Breakdown:
Preclinical Research: $50-100M (25-30%)
Clinical Trials: $150-300M (45-50%)
Regulatory Affairs: $25-50M (8-10%)
Manufacturing Setup: $75-150M (15-20%)
Revenue Potential Assessment
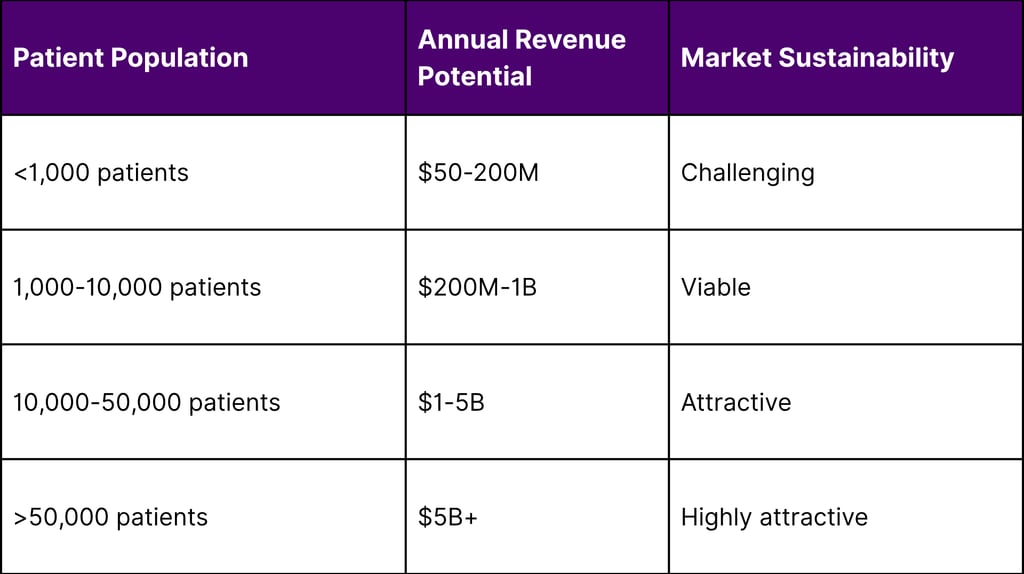
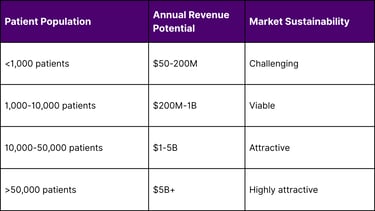
Return on Investment Analysis
Successful Rare Disease Programs:
Peak Sales: $2-8B annually
Development ROI: 15-25%
Time to Peak Sales: 8-12 years post-approval
Market Exclusivity: 7-10 years
Technology Solutions Addressing the Gap
Platform Approaches
Gene Therapy Platforms:
Adeno-Associated Virus (AAV): Broad applicability
Lentiviral Vectors: Stable gene expression
CRISPR/Cas9: Precise gene editing
Base Editing: Reduced off-target effects
Drug Repurposing Strategies:
AI-Driven Discovery: Accelerated identification
Phenotypic Screening: Mechanism-agnostic approaches
Combination Therapies: Enhanced efficacy
Regulatory Pathways: Faster approval routes
Manufacturing Innovation
Flexible Manufacturing:
Modular Systems: Scalable production
Quality by Design: Built-in compliance
Continuous Manufacturing: Reduced costs
Distributed Networks: Regional production
Investment Landscape Evolution
Venture Capital Trends
Funding Patterns (2020-2025):
Total Investment: $45B in rare disease companies
Average Series A: $40M
Late-Stage Rounds: $150M average
Exit Values: $5-15B for successful programs
Strategic Partnership Models
Risk-Sharing Approaches:
Pharma-Biotech Partnerships: Shared development costs
Government Collaborations: Public-private partnerships
Patient Foundation Funding: Community-driven support
International Consortiums: Global development programs
Regulatory Innovation Addressing the Gap
FDA Modernization Initiatives
Accelerated Pathways:
Breakthrough Therapy Designation: Expedited review
Accelerated Approval: Surrogate endpoints
Fast Track Designation: Rolling submissions
Priority Review: Shortened timelines
Guidance Development:
Complex Innovative Trial Designs: Adaptive approaches
Real-World Evidence: Post-market requirements
Patient-Focused Drug Development: Stakeholder engagement
Rare Disease Endpoints: Fit-for-purpose measures
International Harmonization
Regulatory Convergence:
ICH Guidelines: Standardized requirements
Joint Scientific Advice: Coordinated guidance
Mutual Recognition: Reduced duplication
Global Development Programs: Synchronized timelines
Patient Advocacy and Disease Awareness
Foundation Impact
Patient Organization Contributions:
Disease Registries: Natural history data
Research Funding: $2B+ annually
Regulatory Advocacy: Policy influence
Patient Engagement: Clinical trial participation
Digital Health Solutions
Technology Enablers:
Telemedicine: Expanded access
Wearable Devices: Continuous monitoring
Digital Biomarkers: Objective measures
Patient-Reported Outcomes: Quality of life metrics
Market Access Innovation
Value-Based Pricing Models
Innovative Approaches:
Outcomes-Based Contracts: Performance guarantees
Indication-Specific Pricing: Targeted value
Installment Payments: Budget management
Risk-Sharing Agreements: Shared uncertainty
Global Access Programs
Expanding Availability:
Named Patient Programs: Pre-approval access
Compassionate Use: Emergency access
International Pricing: Tiered structures
Donation Programs: Humanitarian access
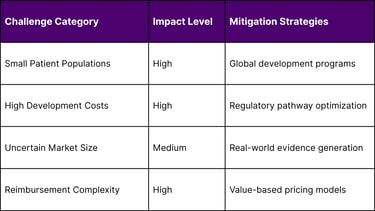
Strategic Solutions to Bridge the Gap
For Pharmaceutical Companies
Portfolio Strategy:
Platform Investments: Versatile technology platforms
Partnership Models: Risk-sharing collaborations
Regulatory Excellence: Accelerated pathway expertise
Global Development: Coordinated international programs
Operational Excellence:
Adaptive Trial Designs: Flexible development approaches
Real-World Evidence: Post-market data generation
Patient Engagement: Community partnership
Manufacturing Flexibility: Scalable production systems
For Biotech Companies
Development Focus:
Mechanism Innovation: Novel therapeutic approaches
Biomarker Development: Precision medicine applications
Combination Strategies: Enhanced efficacy
Regulatory Strategy: Optimal pathway selection
Commercial Preparation:
Market Access Planning: Early payer engagement
Patient Support Programs: Comprehensive services
Global Expansion: International partnerships
Digital Health Integration: Technology-enabled care
For Investors
Investment Strategies:
Portfolio Diversification: Balanced risk distribution
Platform Technologies: Broad applicability
Regulatory Expertise: Development success factors
Global Opportunities: International expansion potential
Risk Management:
Clinical Development Risks: Milestone-based funding
Regulatory Pathway Risks: Multiple strategy approaches
Commercial Risks: Market access preparation
Technology Risks: Platform diversification
Emerging Solutions and Future Outlook
Artificial Intelligence Applications
AI-Driven Solutions:
Drug Discovery: Accelerated target identification
Patient Stratification: Precision medicine approaches
Clinical Trial Design: Optimized protocols
Regulatory Strategy: Pathway optimization
Gene and Cell Therapy Revolution
Therapeutic Platforms:
In Vivo Gene Editing: Direct therapeutic application
Cell Reprogramming: Regenerative approaches
Synthetic Biology: Engineered therapeutic systems
Tissue Engineering: Replacement strategies
Regulatory Evolution
Future Frameworks:
Adaptive Licensing: Flexible approval processes
Real-World Evidence Integration: Post-market surveillance
Patient-Centric Endpoints: Meaningful measures
Global Harmonization: Coordinated requirements
Quantifying the Opportunity
Market Sizing Analysis
Total Addressable Market (2030):
Treated Diseases (5%): $150B
Untreated Diseases (95%): $2.85T potential
Realistic Capture (20% by 2030): $570B opportunity
Investment Required: $200-300B
Development Pipeline Analysis
Current Pipeline Strength:
Preclinical Programs: 2,500+ active
Phase I/II Trials: 800+ ongoing
Phase III Trials: 150+ active
Regulatory Submissions: 50+ expected annually
Conclusion
The orphan drug paradox represents both the greatest challenge and the most significant opportunity in pharmaceutical development today. While the gap between regulatory support and therapeutic availability is stark—with only 5% of rare diseases having approved treatments despite 7,300+ FDA designations—this disconnect illuminates a path forward for industry transformation.
The root causes of this paradox are complex and interconnected: scientific challenges, commercial constraints, regulatory complexity, and resource limitations. However, emerging solutions across technology platforms, regulatory innovation, and commercial models are beginning to address these fundamental barriers.
The convergence of gene therapy breakthroughs, AI-driven drug discovery, platform technologies, and innovative financing models is creating unprecedented opportunities to bridge the treatment gap. Organizations that can navigate the complex development landscape, build scalable platforms, and create sustainable commercial models will not only serve the humanitarian imperative but also capture significant value in the $374+ billion rare disease market.
The orphan drug paradox is not an insurmountable challenge—it is a call to action for the pharmaceutical industry to innovate, collaborate, and transform. The 400+ million patients affected by rare diseases deserve better than the current 5% treatment availability. The industry has the tools, resources, and regulatory support to dramatically improve these outcomes.
The question is not whether we can solve the orphan drug paradox, but how quickly we can mobilize the resources, partnerships, and innovation necessary to transform this crisis into opportunity. The time for incremental improvement has passed; the moment for revolutionary change is now.
The orphan drug paradox will be remembered as either the greatest missed opportunity in pharmaceutical history or the catalyst that transformed rare disease treatment forever. The choice is ours to make, and the patients are waiting.
FAQs
1. What is the “Orphan Drug Paradox”?
The paradox refers to the disconnect between the 7,300+ FDA Orphan Drug Designations granted since 1983 and the fact that only about 5% of rare diseases currently have an approved treatment. This reveals a major gap between regulatory recognition and therapeutic development.
2. How many rare diseases currently have FDA-approved treatments?
As of 2025, only about 350 out of 7,000+ rare diseases have one or more approved therapies, accounting for just 5% of known rare conditions.
3. Why is there such a low approval rate despite high regulatory activity?
While many drugs receive Orphan Drug Designation (ODD), scientific, commercial, and infrastructure challenges slow down or halt development. The typical approval rate from ODD to actual treatment is around 11.6%.
4. What incentives are offered through the FDA’s Orphan Drug Act?
Approved orphan drugs receive:
7 years of market exclusivity
Tax credits for clinical trial costs
Waived fees for regulatory submissions
Access to FDA guidance throughout development
5. Which rare disease categories face the highest treatment gaps?
Neurological Disorders: Only 3.8% have treatments
Metabolic Disorders: 10.6% treated
Rare Cancers: 22.5% treated
Neurological diseases are the most underserved, despite being among the most debilitating.
6. What are the biggest scientific barriers in rare disease drug development?
Disease heterogeneity
Lack of biomarkers
Small patient populations
Poor understanding of disease mechanisms
These factors complicate both research and clinical trial design.
7. What role does venture capital play in rare disease research?
Venture capital has invested $45B+ between 2020 and 2025, with increasing interest in gene therapy platforms and precision medicine that can scale across multiple rare conditions.
8. Can artificial intelligence (AI) accelerate rare disease drug development?
Yes. AI is being used to:
Identify drug targets faster
Stratify patient populations
Optimize trial designs
Predict regulatory pathways
This speeds up development and lowers costs.
9. Are regulatory agencies adapting to better support orphan drug development?
Yes. The FDA, EMA, and global regulators are implementing:
Accelerated approval pathways
Real-world evidence models
Adaptive trial frameworks
Harmonized international guidance
10. What is the commercial opportunity in solving the orphan drug paradox?
Capturing even 20% of the untreated rare disease space by 2030 could represent a $570B+ market, with long-term exclusivity, premium pricing models, and global patient demand.
11. How can pharmaceutical and biotech companies bridge the treatment gap?
By:
Investing in gene and cell therapy platforms
Building real-world evidence infrastructure
Using adaptive trial designs
Partnering with patient advocacy groups and regulators
Prioritizing scalable, platform-based development
12. What’s the role of patient organizations in rare disease innovation?
They:
Maintain disease registries
Fund early-stage research
Drive trial recruitment
Shape regulatory and policy frameworks
Patient advocacy is critical for momentum and impact.
References
U.S. Food and Drug Administration (FDA) – Orphan Drug Designations and Approvals
European Medicines Agency (EMA) – Orphan Medicines
National Institutes of Health (NIH) – Rare Diseases Research & Support (NCATS)
World Health Organization (WHO) – Global Health Estimates and Rare Disease Impact
Peer-Reviewed Clinical and Policy Research
Navigation
© 2026 FyreIgnis Market Research. All rights reserved.
Legal
info@fyreignismarketresearch.com
India